この記事のWVDは”Windows Virtual Desktop Spring 2020 Release”が対象です。
環境構築編 の続きとなる、Windows Virtual Desktop のログを Azure Log Analytics に集約する話です。 Azure の標準機能で コントロールプレーンや仮想マシンのログを集約し、検索することが可能です。 なお、Virtual Machine編では Azure Virtual Machine の Metrics 情報の集約、ATP編では Defender ATP のログ集約もやってみます。
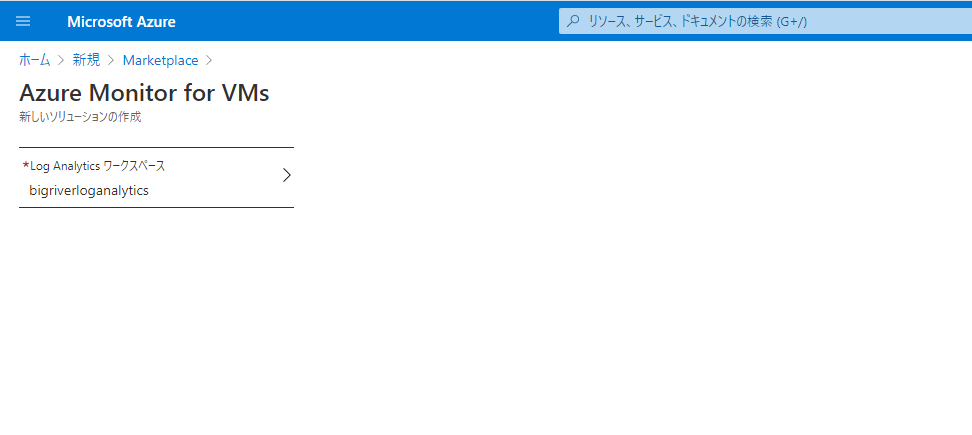
まずは Azure Monitor を作成します。 連携する Log Analytics のワークスペースも指定します。
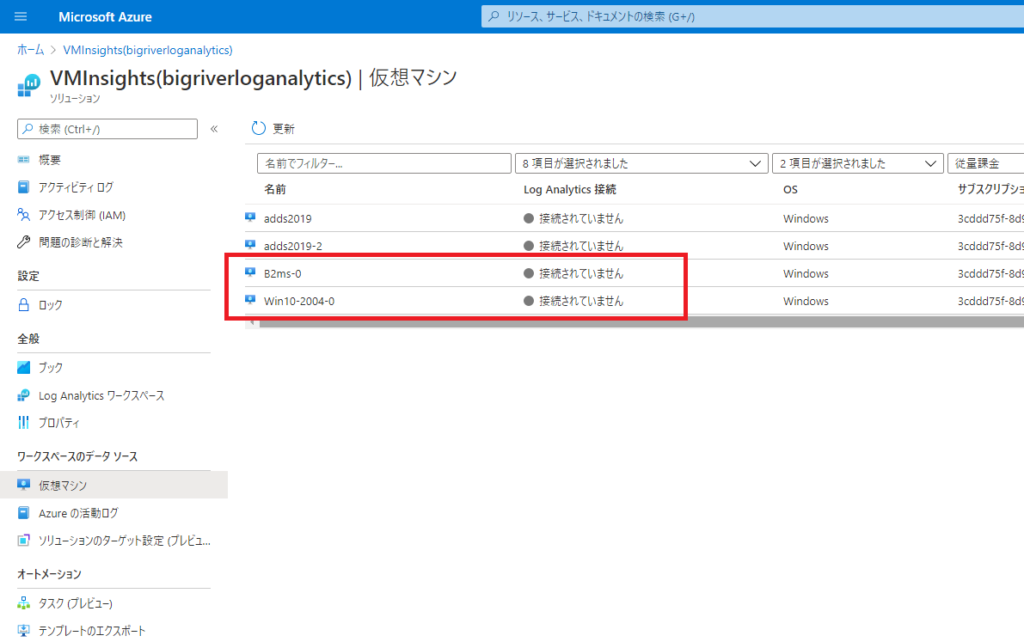
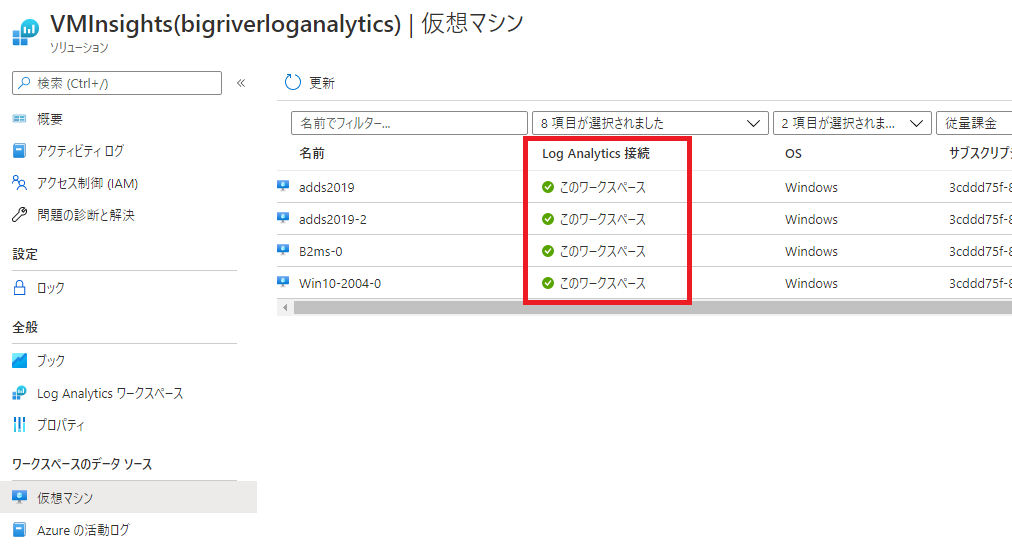
ワークスペースのデータソース > 仮想マシン から今回の対象となる Session Host を選択します。
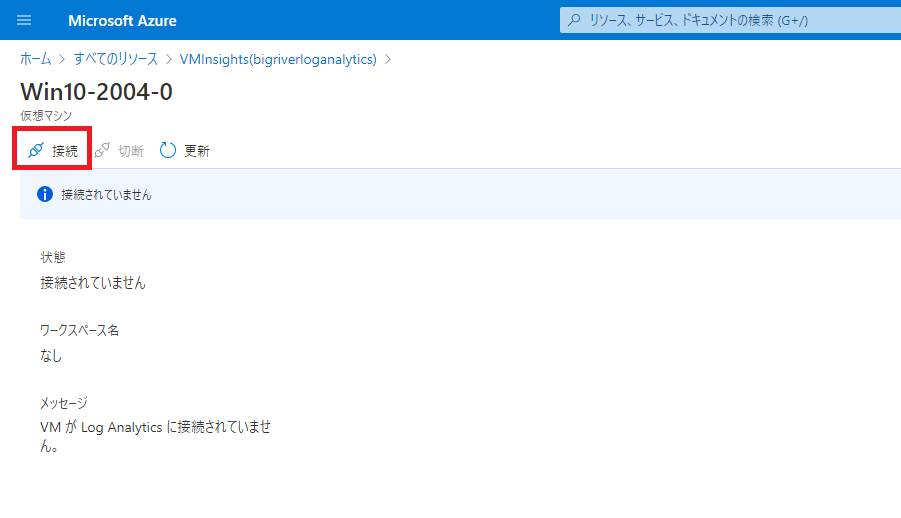
“接続”をクリックします。 接続完了までは3-4分かかります
接続が完了すると以下のように緑色のアイコンで正常性を確認できます。
次はパフォーマンスデータの収集の設定です。 詳細な手順は Microsoft Docs を参考にしてください。
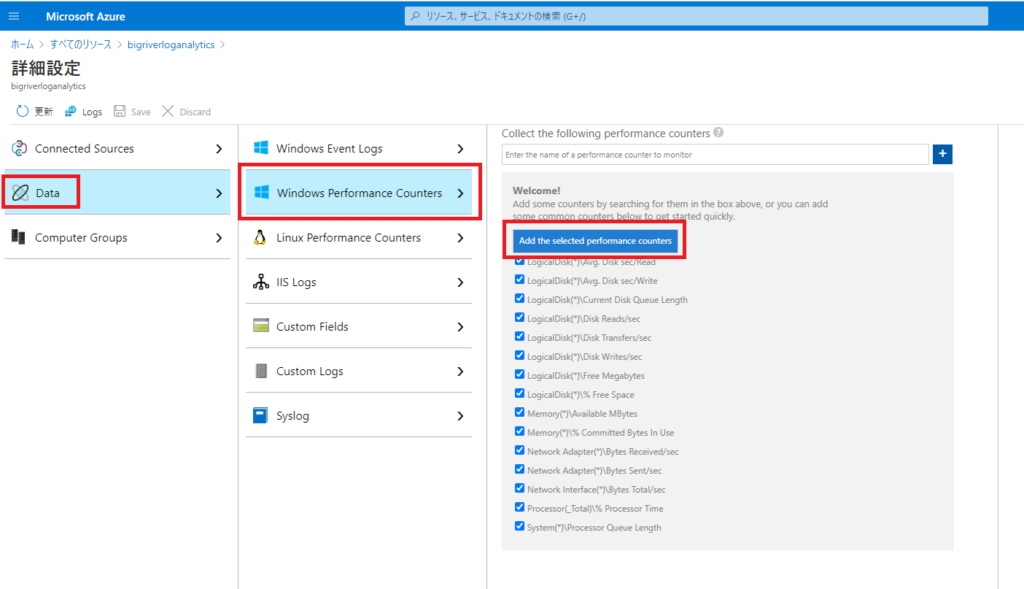
詳細設定から Data > Windows Performance Counters を展開し、”Add selected performance counters” をクリックします。
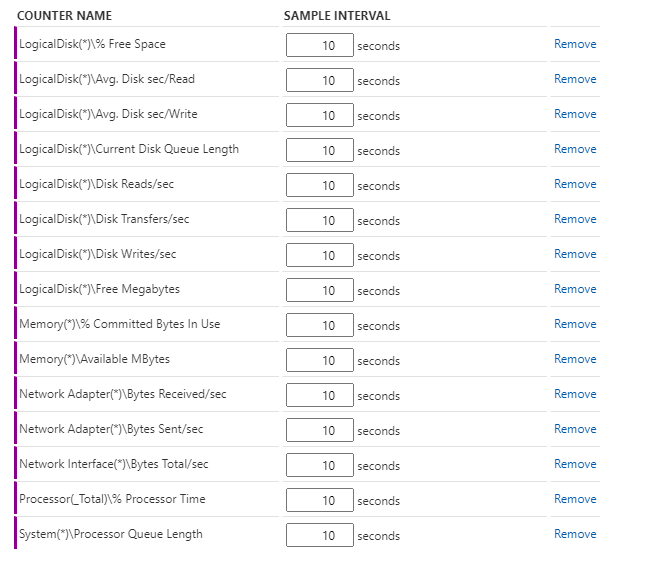
取得間隔も変更できます。 今回は規模の小さなテストなので既定値の10秒のままとします。 何百台、何千台の Windows Virtual Desktop 環境ではログの保存量(=コスト)も考えてインターバルを調整するとよいと思います。 全体的な傾向を把握するのであれば60秒や180秒、300秒でもよいでしょうし、性能に関するトラブルシューティングの場合にはこの既定の10秒やもっと小さい数字にしてもよいかもしれません。 変更後は “Save”を忘れずにクリックしましょう。
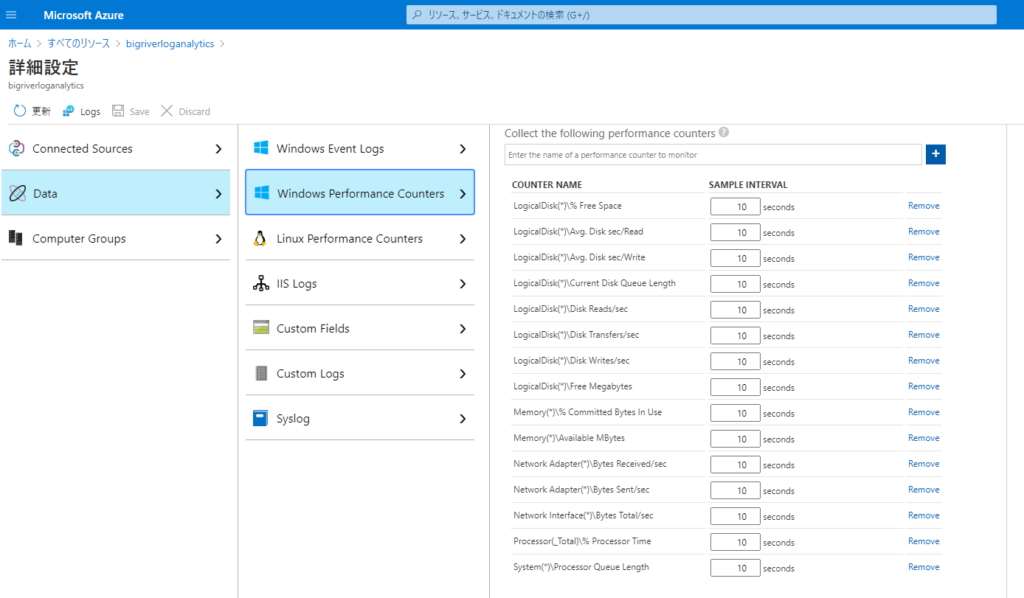
最終的には以下の構成となりました。
収集したログデータを確認します。
Log Analytics ワークスペースの管理画面からログを選択し、クエリから”Virtual Machines” を選択します。
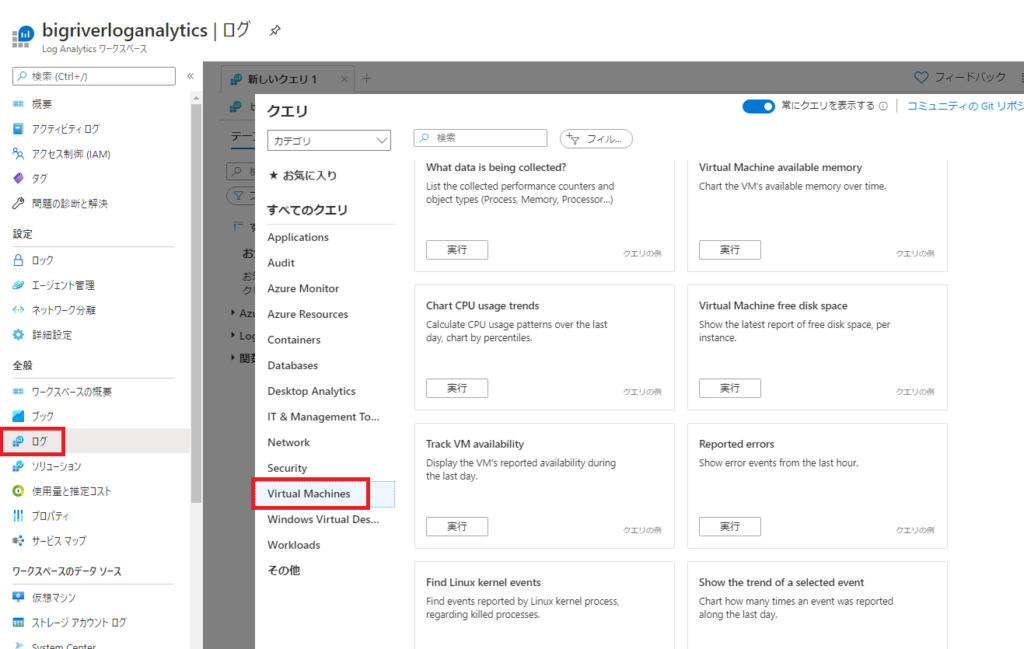
サンプルのクエリーが多数用意されています。 以下、71個ですが、今回の Windows Virtual Desktop 環境で有用そうなものを太字にしてピックアップします。
- What data is being collected?
- Virtual Machine available memory
- Chart CPU usage trends
- Virtual Machine free disk space
- Track VM availability
- Reported errors
- Find Linux kernel events
- Find Linux kernel events
- Missing security or critical updates
- Members added to security groups
- Uses of clear text password
- Windows failed logins
- Search in multiple tables
- Using wild-cards
- Top 10 Virtual Machines by CPU utilization
- Bottom 10 Free disk space %
- Logical disk space % below threshold:
- Shut down Virtual Machines
- Not reporting VMs
- Stopped Windows services
- Updates available for Windows machines
- Updates available for Linux machines
- Summary of updates available across m
- Patch installation failure for your machin
- All Events in the past hour
- Events started
- Events by event source
- Events by event ID
- Warning events
- Count of warning events
- Events in OM between 2000 to 3000
- Computers restarts/shutdowns
- Windows Fireawall policy settings
- Windows Fireawall policy settings chang
- List IIS log entries
- Display breakdown respond codes
- Maximum time taken for each page
- Show 404 pages list
- Average HTTP request time
- Servers with internal server error
- Count IIS log entries by HTTP request m
- Count IIS log entries by HTTP user agent
- Count IIS log entries by client IP address
- IIS log entries for client IP
- Count of IIS log entries by URL
- Count of IIS log entries by host
- Total bytes traffic by client IP
- Bytes received by each IIS computer
- Bytes responded to clients by each IIS se
- Average HTTP request time by client IP
- All Syslog
- All Syslog with errors
- All Syslog with errors
- All Syslog by process name
- Agents that provide wire data
- IP Addresses of the agents providing wir
- All Outbound communications by Remot
- Bytes sent by Application Protocol
- Bytes received by Protocol Name
- Total bytes by IP version
- Remote IP addresses that have commun
- Processes that initiated or received net
- Amount of Network Traffic by Process
- What data is being collected?
- Virtual Machine available memory
- Chart CPU usage trends by computer
- Chart CPU usage trends by computer
- Track VM Availability using Heartbeat
- Top 10 Virtual Machines by CPU utilization
- Bottom 10 Free disk space %
- Logical disk space % below threshold
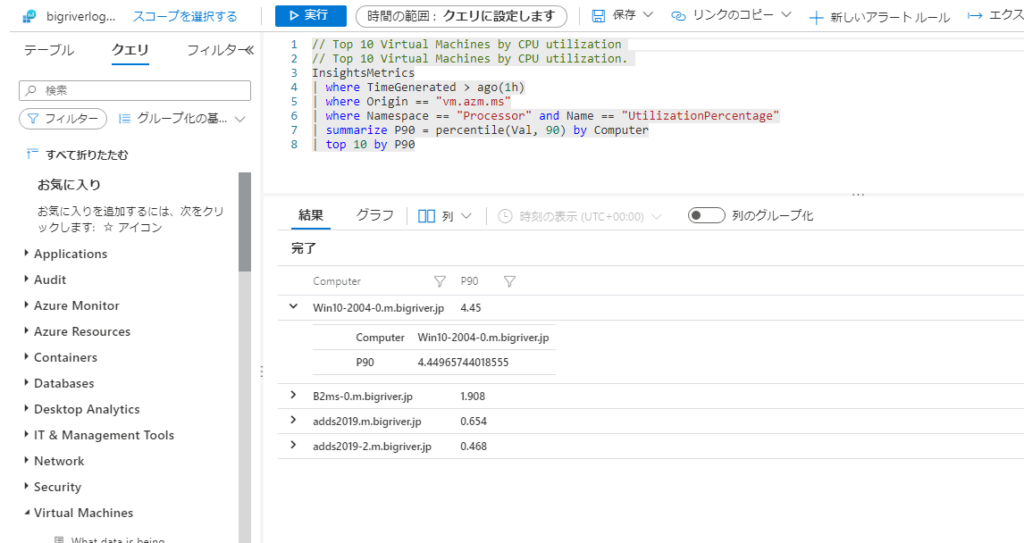
“Top 10 Virtual Machines by CPU utilization”
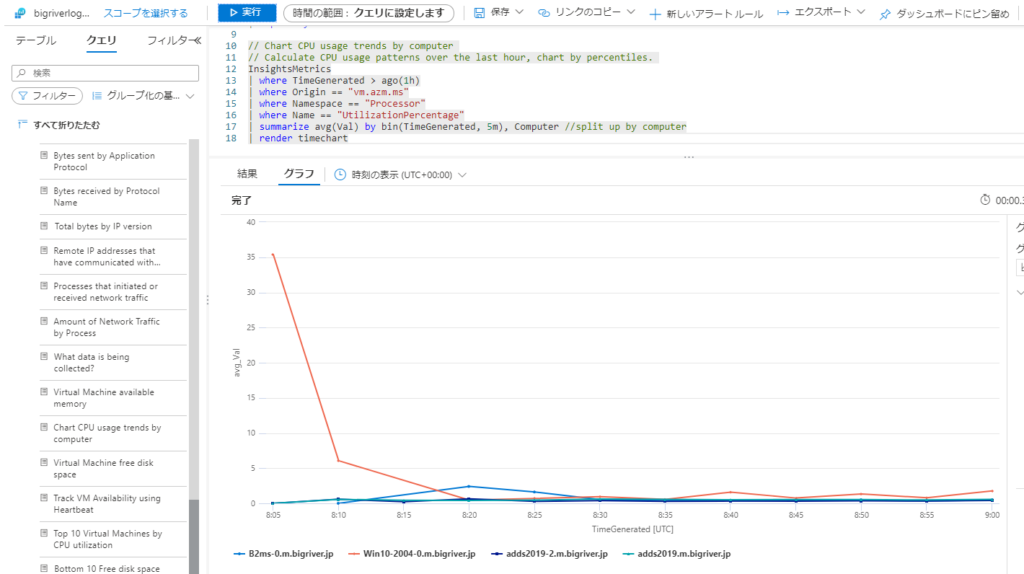
“Chart CPU usage trends by computer “
以上